Don’t just create KPI’s and hope they work, take control and ownership of your business plan to achieve your greatest growth!
FREE, On-Demand Webinar: Part 2 – HVAC KPI’s
Your Roadmap to Success: Understanding Industry Benchmarks and Departmentalization
This presentation covers two important aspects of your HVAC Business that need to be locked in:
- HVAC Specific KPI’s
- Departmentalization Strategy
Brad Hone, Director of Comfort Institute, alongside Tracy Martin, Director of Dealer Development, discuss the significance of choosing appropriate indicators and departmentalizing accordingly to make the best analysis of your companies performance. These are benchmarks that industry leaders are applying and that allow you to set a path for a prosperous future. Defining indicators is the simple part, but departmentalizing is often a missed step. Brad shares his experience of why it is imperative that you break your company into smaller pieces so that you truly understand how the business is performing and aren’t guessing where the problem is. By themselves they hold some value but, together they give transparency and pave your road to success!

Brad Hone
Director

Tracy Martin
Director of Dealer Development
For more information, contact us Today!
Alex Rice: 937-475-4487 or Alex.Rice@ComfortInstitute.org | Brad Hone: 937-694-0635 or Brad.Hone@ComfortInstitute.org
Financial Statements are the part of running a business that many owners or managers dont like or care for. We would much rather be selling something, fixing something, interacting with homeowners, motivate our associates, etc. But without knowing your numbers you could be setting yourself up for failure.
There are 3 basic pieces to your statement:
- Income Statement (P&L or Profits and Losses)
- Balance Sheet
- Cash Flow Statement
As owners and leaders, the success of your company is riding on the fact you know these items for growth and consistency. Your accountants, if you have them, should have a good grasp on these numbers and be reporting them back to you to ensure you have a good understanding of how your company is operating financially. Many who start a company are great technicians and great at their trade but lack the business acumen needed to drive a business in the right direction for growth.

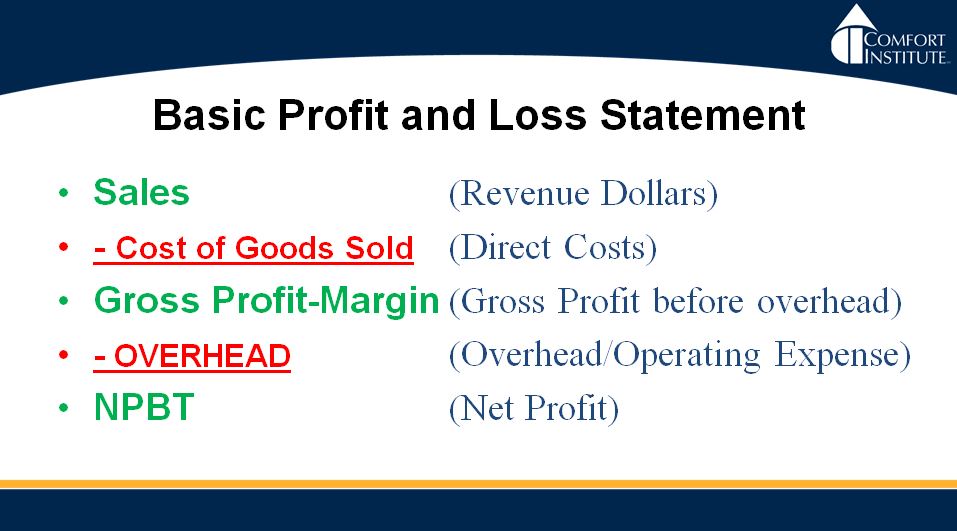
The profit and loss statement is essentially your report card, providing you the “pulse” of your business. The above equation shows you how to get your gross margin and net profit. Sales minus your costs of goods sold gives you your gross profit or margin. Direct cost being the value of all goods required for you to complete the job(s). Then you subtract your overhead (your rent/lease, electric, wages, benefits, etc.) from the gross margin to give you your net profit before taxes. Unfortunately, in our industry the average net profit an HVAC contractor is less than 3%. Double digit profit is what we need to strive to hit. So let’s break down the P&L Statement.
1.) Where does your REVENUE come from?
- Demand Service (No heat/No cool)
- Replacement (This makes up the majority of your revenue / should be responsible for 70-75%)
- IAQ/Accessories and Home Performance
- Service Agreements
2.) The second item is OPERATING COST OR COST OF GOODS SOLD (COGS). Many contractors, unfortunately, do not properly name or even know what all of their operating costs are. Owners are typically quick to recognize expenses like parts and materials, equipment, labor, commisions, subcontracting fees, equipment rentals, permit expenses, etc. A warranty, if tracked, could be anywhere from 1-3% set aside in a reserve account for warranty jobs set aside for the length of the warranty you sold. The buydown included in your operating expenses are the finance charges you absorb through whoever you use to finance your jobs in the field. An important key is that you know and approve what offering your employees in the field are providing. Some financing offers could cost you up to 15% and if you arent job costing each sold job then you may not know whats being offered. This will be devastating to you Gross Margins and Profit. Allocated Fringes, often referred to as labor burden, includes the benefits to your employees such as vacation, FICA, workers comp, 401k, medical, etc. A good rule of thumb on average, and depending on what your company offers, is 25-30%. This means that if you hire an employee at $10/hr then they are effectively costing you about $13/hr after you roll all their benefits into it.
So your Revenue (1.) minus your Operating Expenses (2.) equals your Gross Margin
3.) Next on the list is your OVERHEAD. Overhead is the cost of doing business and varies in relation to sales. It is difficult to assign overhead to specific departments and the majority of small to mid sized companies do not assign overhead to a division in relation to total sales volume. When used correctly, overhead can be a great tool to build your budget around.
There are 5 main categories of overhead:
- Marketing (Social Media, Website, Internet Ads, Direct Mail, Radio, Newspaper, Home Shows, etc.)
- Employee Related (Wages, Benefits Package, Uniforms, Tools, Drug Testing, Hiring Expenses, Training, etc.)
- Plant and Equipment (Depreciation, Repairs/Maintenance, Utilities, Telephone, Cleaning Services, Insurance, Taxes, etc.)
- Vehicle Related (Leases, Insurance, Fuel, Maintenance, etc.)
- Administrative (Outside Auditor, Legal Expenses, Office Supplies, Cell Phones, Travel, etc.)
Subtracting Overhead (3.) from your Gross Margin gives you your Net Profit Before Taxes

So what is Departmentalization? It is the division of an organization into sections based upon operating functions.
And why is it important? Revenue and operating costs all align into their own respective departments.
With an appropriate departmentalization strategy you can properly manage a division with industry Key Performance Indicators to strive for, recognize and improve upon.
- Evaluate each department/service/product
- Ensure accountability, allowing you to hold managers/leaders/co-workers to goals set forth
- “Good people want to be held accountable”, remember that phrase
- Compensate accordingly based on performance
- Defines your business mix
- Aids in budgeting and pricing strategies
How do you get extraordinary results from ordinary people? Departmentalization is a plan that requires you build a strategy. You then implement it. Execute it. Hold each department accountable. Afterwards it is crucial that you measure and track the results because what isnt measured cannot be managed. Review the process and make adjustments as necessary.
How do I Departmentalize? You choose departments based on the type of work you are doing in your company and by analyzing th co-workers you have working for you. Knowing the individual numbers of these departments seperated out instead of all residential being under one bucket, for example, lets you quickly analyze what is going on in your business. Knowing your numbers on a daily basis allows you to be proactive and fix a potentially devastating issue prior to the month end P&L statement. Common departments in the industry are:
- Residential Service (No Heat/ No Cool)
- Light Commercial Service
- Residential Replacement (Replacements)
- Light Commercial Replacement
- Residential Maintenance (Annual Tune-Ups)
- Light Commercial Maintenance
- Residential New Construction
- IAQ
Many companies still lump all of their revenue and cost of goods into one company department. This provides no insight as to where the revenue is truly coming from nor where your expenses are coming from either. Under this scenario you have no idea how to fix problems that might arise because there is no granularity to quickly point you in the direction of the problem. Brad suggests that 7 out of 10 contractors he has worked with over the years were using this type of lump sum approach. This is a driving factor in why our industry average Net Profit is less than 3%. We can change that right here.
Lets start by identifying your departments. Then set up a chart of accounts to break down your revenue into smaller pieces (Service parts would be seperate from warranty parts or return call parts for instance) along with your Cost of Goods. There is no cookie cutter approach to this, each company is unique so proceed accordingly and fine tune as needed. Once you have gotten all the accounts established you need to assign numbers to them for accounting purposes.
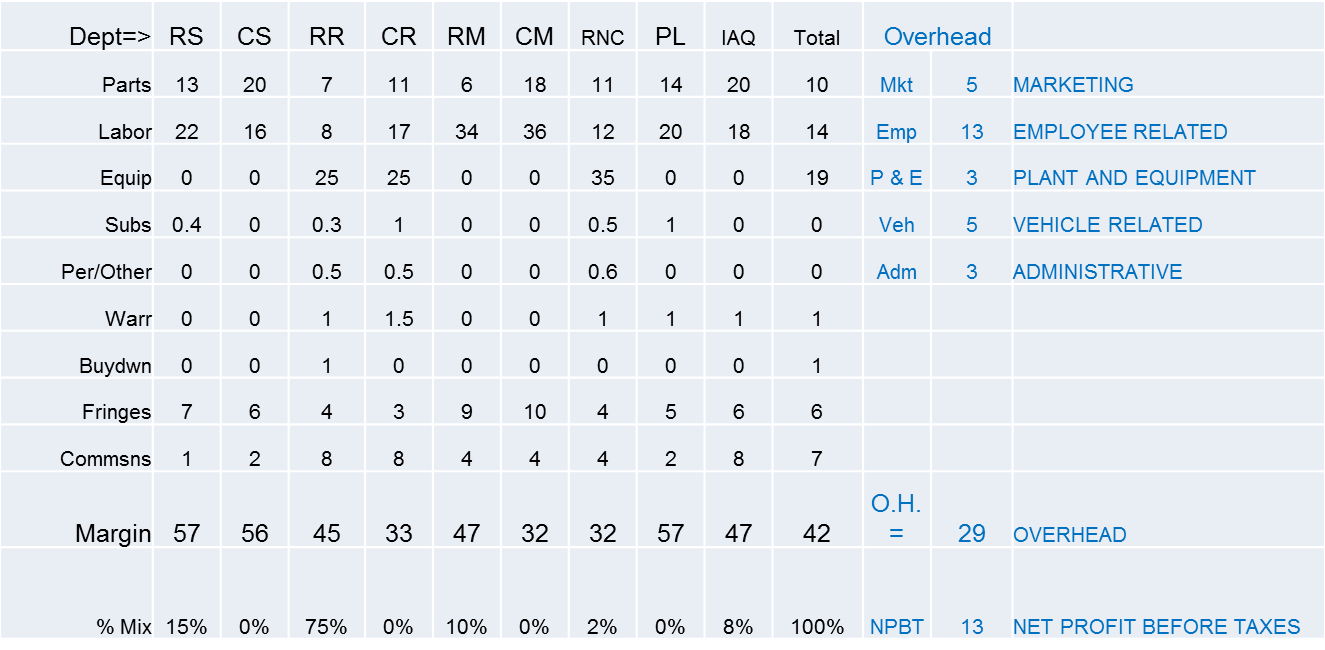
Now lets talk Key Performance Indicators and Benchmarks for the HVAC industry. The below chart shows KPI’s to strive for and many reading this may already be outperforming these numbers.

All of these numbers are expressed in percentage of total sales volume. The black font represents Revenue and the acronyms across the top are the departments we segmented out earlier in this presentation. For instance, RS = Residential Service and CS = Commercial Service. The last column in black to the right before the font goes to blue shows “total” and this is the percentage for each Cost of Good category rolled into a company percentage. If you read down towards the bottom you find your margins as well. Knowing your numbers allows you to know where you stand against your benchmarks so you can adjust accordingly to remain profitable and make the desired Net Profit that the company seeks to achieve. In total, an HVAC business should be aiming for no less than 42% gross margin.
On the right hand side of the chart you see blue font. All of that is your overhead expenses along with the percentage each category should make up of your annual profit. For instance, Marketing should make up no more than 5% of you annual profit. Moving down the chart, you see that all overhead categories should make up no more than 29% of your business.
42% Gross Margin minus 29% Overhead gives you the 13% Net Profit Before Taxes we showed at the beginning of this presentation
Many owners and contractors in the industry do not know these numbers and if you arent departmentalized in a manner that clearly breaks down your operations, then you will never know if a certain department in your business is holding you back from double digit net profits.
Labor is the key to success in your business. Unapplied labor is the killer. The technician standing around after a training for 30 minutes, sitting in their truck waiting for the next dispatch call to come through, hanging out at the distributor waiting on parts because they need to restock their vehicles, etc. These are hours that we are paying our techs when they arent actively on a job, and thats costing us. This leads back to accountability. Holding your techs accountable as well as yourself, the manager, to ensure they are performing and you are providing the tools necessary for them to perform is the key to keeping your margins high. Make cetain that your staff is trained properly, provide them the tools to succeed, set the expectation and get out of their way to produce results.
*** Minutes 36 to 45 of the video have a breakdown of charts with Key Performance Indicators you should be achieving ***

So what if you residential service labor is too high? Consider these scenarios to be holding you back:
- Flat rate pricing time is incorrect
- Poor diagnostics or troubleshooting skills which leads to excessive time
- Single task service work orders
- Technicians doing warranty/call back work and not charging to the correct department
- Miscoding time sheets
- Poor dispatching
- Uncontrolled overtime
- Imporper truck stock
Residential Service Parts or Material Costs too High? Maybe you are experiencing some of these examples:
- Technicians not held accountable for their truck inventory
- No standard truck stock
- No purchase order process in place
- No control in your warehouse
- Flat rate pricing is out of date
- Not properly recovering manufacturers warranty
If your business is not setting KPI’s by department and not just on the company as a whole, you will struggle to find the root cause of your issues which will only hold you back from your full potential. Start setting goals that are attainable and up to par with other industry leaders, departmentalize accordingly to capture your business mix and hold accountability. Put your business on a path towards growth and see the results.
For more information, contact us Today!
Alex Rice: 937-475-4487 or Alex.Rice@ComfortInstitute.org | Brad Hone: 937-694-0635 or Brad.Hone@ComfortInstitute.org
